

The September Logistics Managers' Index rose its second-highest reading in four years.
Increasing inventory levels are squeezing space, increasing costs.
One of the highest rates of space contraction ever measured by the LMI.
The U.S./Israel war with Iran and the Trump administration’s tariffs continue to fuel inflation, according to the latest release of a key supply chain indicator.
The September Logistics Managers' Index rose to its second-highest reading in four years, as inventory levels and costs surged and put pressure on warehousing.
The Index is up 3.6 points from August.
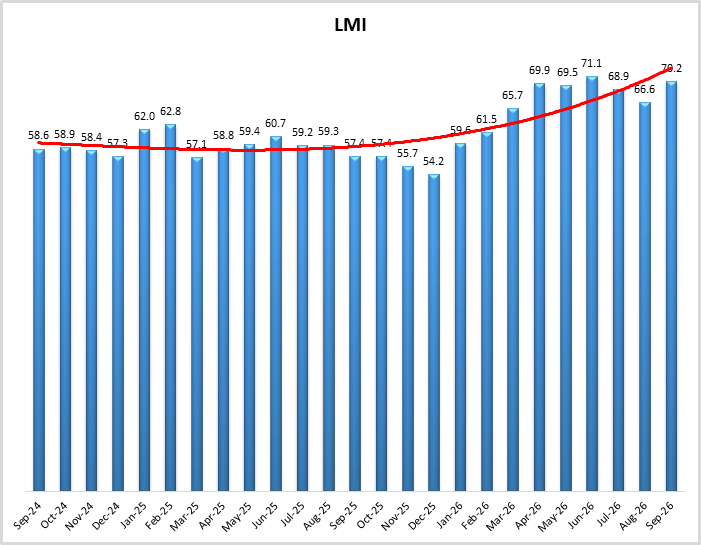
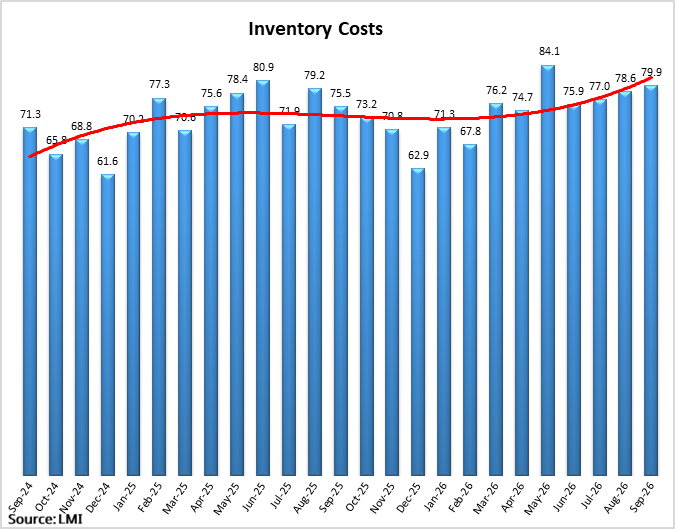
“This is the second-highest reading in four years, behind only June’s reading,” explained Dale Rogers, a professor in the supply chain management department at Arizona State University and one of the authors of the LMI. “Breaking the trend of the previous two months, we observe an increase (+6.1) in the rate of expansion for Inventory Levels this month. This has driven a continued increase in Inventory Costs (+1.3) to 79.9 and is also having a significant effect on the warehousing market.”
The LMI tracks eight components across three logistics pillars: inventory (levels and costs), warehousing (capacity, utilization, and prices), and transportation (capacity, utilization, and prices). As a diffusion index, any reading above 50.0 signals expansion; below 50.0 signals contraction.
Warehouse space is squeezed because product companies front-loaded ahead of the USTR 301 forced labor tariffs, and those products are still being stored longer and racking up costs.
This is why I keep stressing inflation is brewing in the warehouse.
Higher-priced products sit on warehouse shelves longer, adding to inventory costs. Eventually, these products hit store shelves at a higher price. This is the transitory inflation the Fed has said they have no control over.
I have been right about warning about price increases in the past. Depending on a product’s shelf cycle, you can see price increases in as little as a few weeks or as long as 9 months, depending on when the products are replaced on store shelves. This is why fruits and vegetables get hit first by energy prices. They have the shortest supply chain cycle.
Because product is sitting longer in warehouses, capacity (available space) fell sharply (-14.2), to a contraction of 39.3 in the September LMI. This was the fastest rate since March of 2022, when supply chains got slammed to a halt due to Russia’s invasion of Ukraine.
“Retailers are not rushing goods in now ahead of potential holiday sales,” said Rogers. “Interestingly, most of these inventories are sitting at the wholesale level. Often, we see inventories transfer from the wholesale to retail level around mid-October.”
The longer-term inventory is reflected in Inventory Costs, which are up (+1.3) to 79.9, their second-fastest rate of expansion since August 2025.
Customer Buying Habits
Rising costs are shifting consumer habits as people try to save money.
Rogers said the continued rise in costs has led some consumers to buy large durable goods early, anticipating further price increases down the road.
“The types of goods being purchased have shifted as well, as increased fuel prices have pushed U.S. car buyers away from heavy trucks and S.U.V.’s and towards more fuel-efficient vehicles,” said Rogers. The albatross hanging over Inventory Costs are tariffs and the uncertainty surrounding them.”
Companies Navigating Inflation
U.S. companies face their own fiscal challenges.
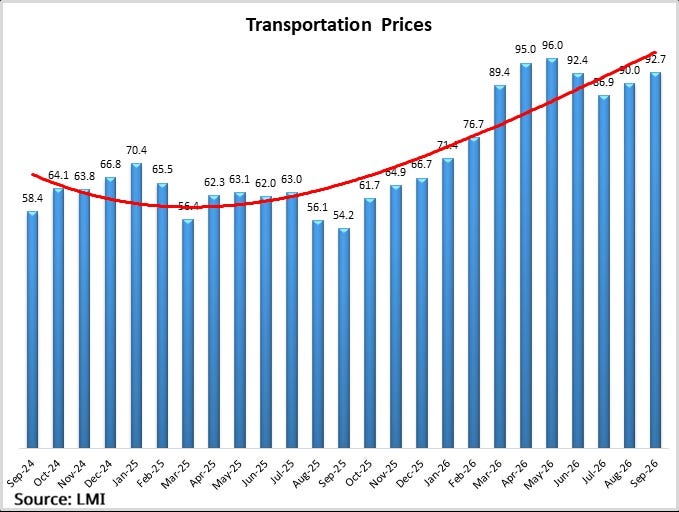
Not only are they paying more for manufacturing and ocean/air freight logistics, but they are also hit with higher trucking costs due to high diesel prices from refinery issues stemming from the U.S./Israel war with Iran, and they are paying more to store their product due to limited capacity. They are also paying for longer storage since their product was brought in earlier.
Longer warehouse time is the ultimate example of trade at rest is not making money.
According to LMI metrics, Warehousing Prices and Transportation Costs run on a scale from 0-300, with 150 being the “breakeven” level. September metrics are up (+2.5) to 246.1.
“This is the highest reading for this aggregate metric since April of 2022, when supply-driven inflation was rampant in the wake of both the cessation of COVID-era demand and the invasion of Ukraine,” said Rogers.
“These high costs are putting significant pressure on supply chains and consumers alike,” he continued.
Who is Storing and Why
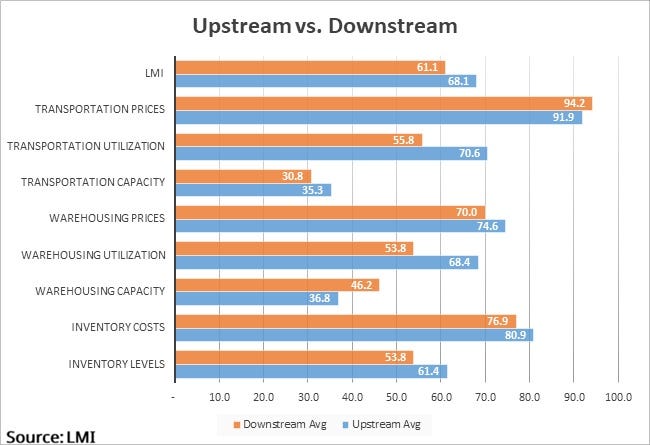
Looking at where the warehouse crunch is most prevalent, the LMI shows it’s “upstream,” where raw materials are stored. This makes sense because components are rising in price due to tariffs and tight inventory of products made from petroleum-based chemicals. Get it in now while you still can.
“Downstream” is the part of the supply chain where warehousing, order processing and fulfillment, distribution, and delivery to the end customer occur.
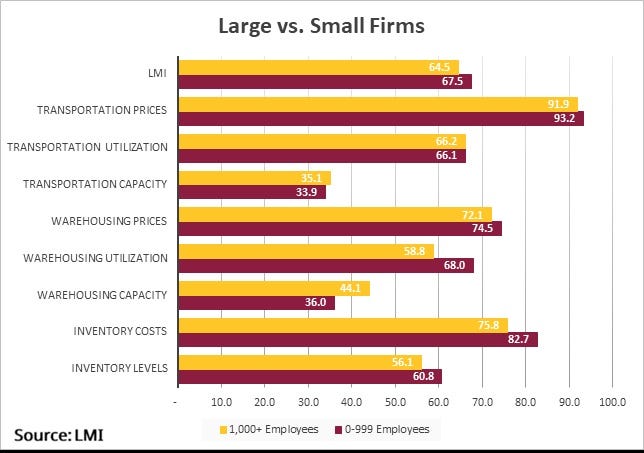
Larger companies can afford to have their product sit in warehouses.
What the Warehouse Tealeaves Tell Us
Retailers and manufacturers are always building for their tomorrow.
Their inventory practices are key to their planning. Looking ahead, LMI respondents suggested the storage market will remain tight, and prices are expected to rise for both storage and logistics.
This is always passed on.
In September, the Federal Open Market Committee (FOMC) unanimously agreed to raise the base rate by 25 basis points to 3.75% to 4%.
The reason: elevated inflation, at 3.4%. In its statement: “Today’s policy action will support a timelier return to the committee’s 2% goal. The committee will deliver price stability.”
This latest reading from the LMI shows inflation’s flames are still smoldering.