

Key regions for Supply Chain Risk were the southern U.S. and Gulf, China, and Latin and Central America- Marsh.
Sea-dependent products such as server racks, switchgear, cooling systems, and petrochemical feedstocks face greater exposure than air-freighted chips.
Panama Canal drought is affecting bulk commodities, container shipping, costs, delays, and accumulation risk.
Inland waterways, including major South American river systems and European rivers, may have limited substitutes.
Tier 3 suppliers are considered invisible in the supply chain and are most at risk- Marsh.
The ocean highway moves around 90 percent of the items in your home. I have written before that both man and Mother Nature create risks to the pivotal ocean trade routes. Mitigation measures we have seen because of the U.S./Israel war with Iran and the Panama Canal Authority’s water-saving measures have created alternative routes and, in turn, new risks.
These developments show why supply chain risk is no longer limited to a single supplier or country. A disruption at one point can quickly move through transportation networks, suppliers, and manufacturers, creating a much larger supply chain disruption.
Supply chain resiliency starts with proactive measures. It begins with using data to analyze all raw materials used in manufacturing and tier providers.
It sounds simple, but it’s not. The list in the analysis of each node is long.
Here’s what needs to be considered: the location of raw materials, manufacturing locations, the routes used to move those raw materials to factories, the transport of finished goods to ocean ports/airports, the ocean routes chosen to move that cargo, and where that product will move by air.
On top of this, you need to layer in the exposure to man-made and environmental risks. Factor all this in, and you have a good sense of what supply chain disruption you can face.
This is why it is essential to know all tier providers in the supply chain. They all factor in these risks.
You think after COVID and the various trade wars, companies would know better. They don’t. This is a huge risk because the lack of knowledge can impact a company’s bottom line through delays and extra costs.
Knowing all of your supply chain tiers is critical because you need to know whether your raw materials and components are at risk of disruption. This is why personal relationships matter. You need to stay in communication with them, as well as alternative suppliers within that tier, so you can pivot if necessary.
You don’t want to be that company that only stays in touch in bad times and demands more supply or turnaround if there are constraints. Loyalty matters and is always remembered.
Man-made Disruption
Let’s start with the first cause of disruption, and that is man-made: physical war, geopolitical conflicts, and policy (trade wars). In today’s political volatility, it’s essential to know where your product comes from because these man-made factors create regional exposure and significant supply chain risk.
Product and component origin is a top focus because if you can’t get the raw materials or components to make your product, you can’t complete it. If there is a shortage of the energy/chemicals that keep your product running, that energy/chemical will be more expensive, or your product will stop working.
We are seeing firsthand the delay of petrochemicals, refined fuels, and crude as a result of the U.S./Israel war with Iran.
For example, U.S. paint and coatings rose about 3.4% through August, according to the Federal Reserve Bank of St. Louis (FRED), since February 2026. Some major manufacturers announced substantially larger increases: Sherwin-Williams (8%) and PPG (up to 20% ).
The petrochemical connection to paint is through resins and solvents, plus energy, packaging, and freight costs. All are up because of the supply chain bottlenecks created by the war. Across the pond, the British Coatings Federation reported that the conflict restricted feedstock supplies and pushed up solvent and resin prices within the first month.
War is not the only supply chain risk creator. Government policies can also change the flow of trade and hit a company’s bottom line.
On the trade side, a new U.S. Customs rule is up for public comment on enhanced import disclosures. The U.S. government is looking to strengthen supply chain visibility to identify key parties in the import process. They are also deploying supply chain tracing technologies to ensure origin can be verified.
“The vast majority of importers aren't looking at verification of country of origin claims,” said Kit Conklin, chief strategy and global affairs officer of Exiger. “Do they really know if the wheelbarrow they are importing came from Mexico or did it just get assembled there and slapped with a sticker that says ‘Made in Mexico’?”
Exiger identified retail, autos, and consumer electronics as the highest-risk sectors.
“Auto companies often source Chinese goods routed through Mexico, while tires and other Original Equipment Manufacturer (OEM) parts may move through Southeast Asia,” explained Conklin. “Examples of OEM parts are the widgets that go into an engine or a braking system. Those are made in Southeast Asia, exported to Mexico, and then they cross from there getting USMCA rates.”
Conklin said additional products in the high-risk category include textiles, gardening items, household items, and even lawnmowers.
“There are entire industries that have been created to help with this type of evasion,” said Conklin. “They're in Mexico, Canada, and to a certain extent in Europe. But it's primarily in Southeast Asia.”
For example, solar panels imported into the United States may not come directly from China, but their supply chains are still heavily tied to Chinese manufacturing in Southeast Asian factories. This expansion was a part of the China plus one strategy in response to the first Trump trade war.
The panels “originate” from Southeast Asian factories in Vietnam, Thailand, Malaysia, and Cambodia, which are either owned or operated by major Chinese solar companies. These companies shifted the panel assembly out of China to avoid U.S. tariffs.
This type of tariff evasion is what the Trump Administration is trying to stop with its executive order on strengthening Customs enforcement. This is why companies need to know every tier of their supply chain providers.
Investors and Wall Street analysts also need this information to assess tariff risk within a company’s supply chain. More tariffs mean more costs to offset.
One sector that has been vetting its supply chain for about a decade is defense.
The U.S. Department of Defense (DOD) is a major client and partner of Exiger, uses the company’s AI-powered supply chain risk management (SCRM) and vending platform to make sure all parts used in the U.S. military are properly sourced.
“DoD has been thinking about country of origin issues for a long time, around 10 years, and while there's still work to be done, they've got a much more mature understanding of the risks and what needs to happen in order to mitigate those risks,” said Conklin. “In Section 805 of the National Defense Authorization Act (NDAA), from two years ago, it prohibits Chinese military companies from being anywhere in a defense supply chain at any level.”
Mother Nature Risks
Droughts, floods, and storms like typhoons and hurricanes also threaten the global supply chain.
Sea-Intelligence’s latest data on port congestion shows you the impact of weather in Asia.
The chart shows country‑level vessel arrival schedule reliability for July and August 2026, along with the Y/Y changes in each month.
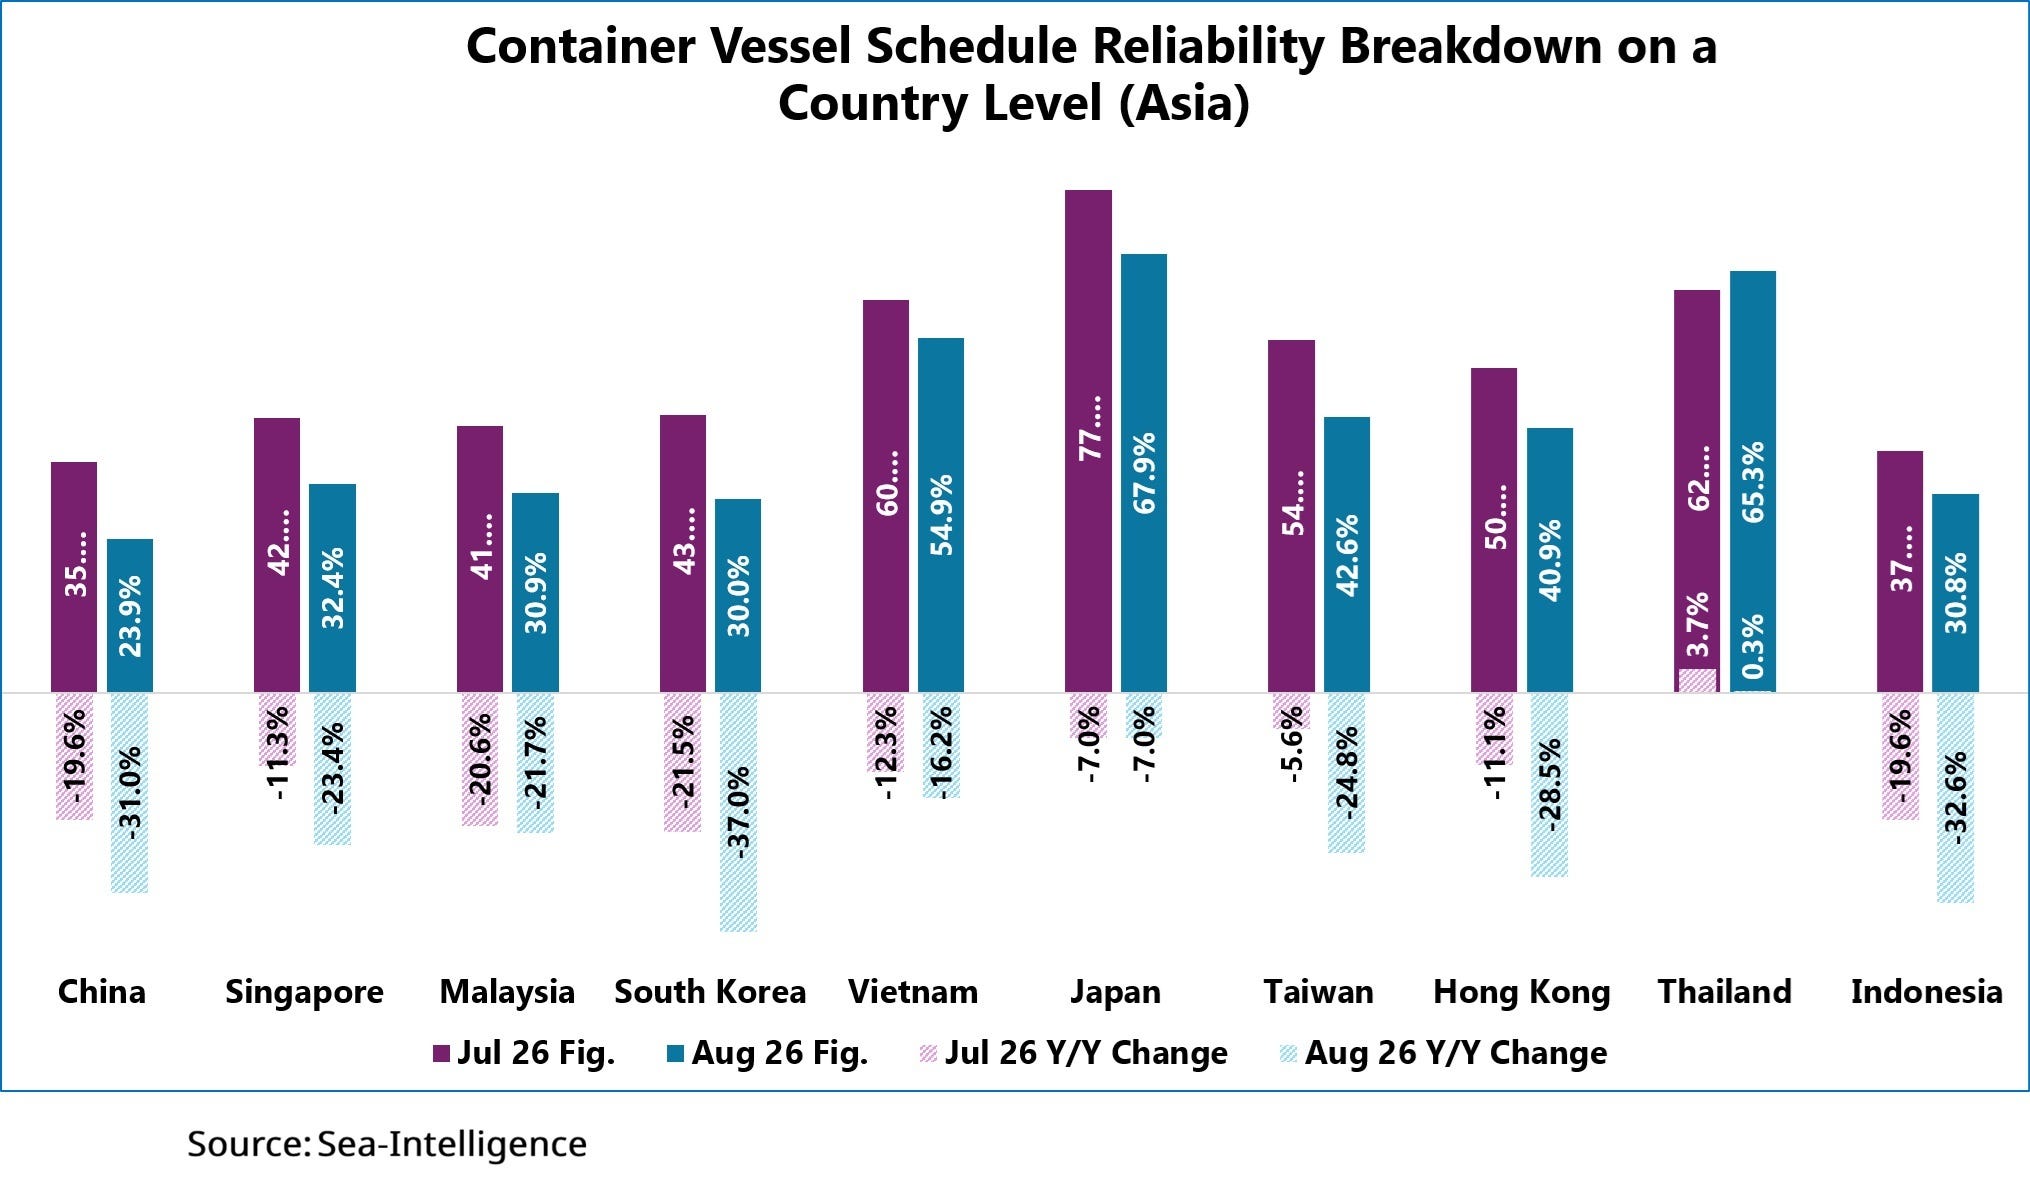
Thailand was the only country not to record a M/M decline in August, with its August 2026 figure 3.0 pp higher M/M. China was the most impacted in August, with vessel schedule reliability dropping to just 23.9%. Shanghai and Ningbo, the country’s two largest ports, saw schedule reliability plummet to 12.2% and 16.9%.
“For nearly all countries, schedule reliability in August was lower than an already poor July, with the M/M declines ranging from ‑5.9 percentage points (pp) in Vietnam to ‑13.1 pp in South Korea. This shows that congestion is not a localized issue but is spread region‑wide,” said Alan Murphy, CEO, Sea-Intelligence.
The World Economic Forum reported that weather-related supply chain disruptions increased nearly 150% between 2021 and 2023, but the trend isn’t stopping.
“It is ongoing, and over the next five years, supply losses related to extreme weather events is expected to reach 1.26 trillion over the next few years,” warned Catherine Cyphus, head of risk, resilience, and technology for the UK within Marsh’s Advisory Practice.
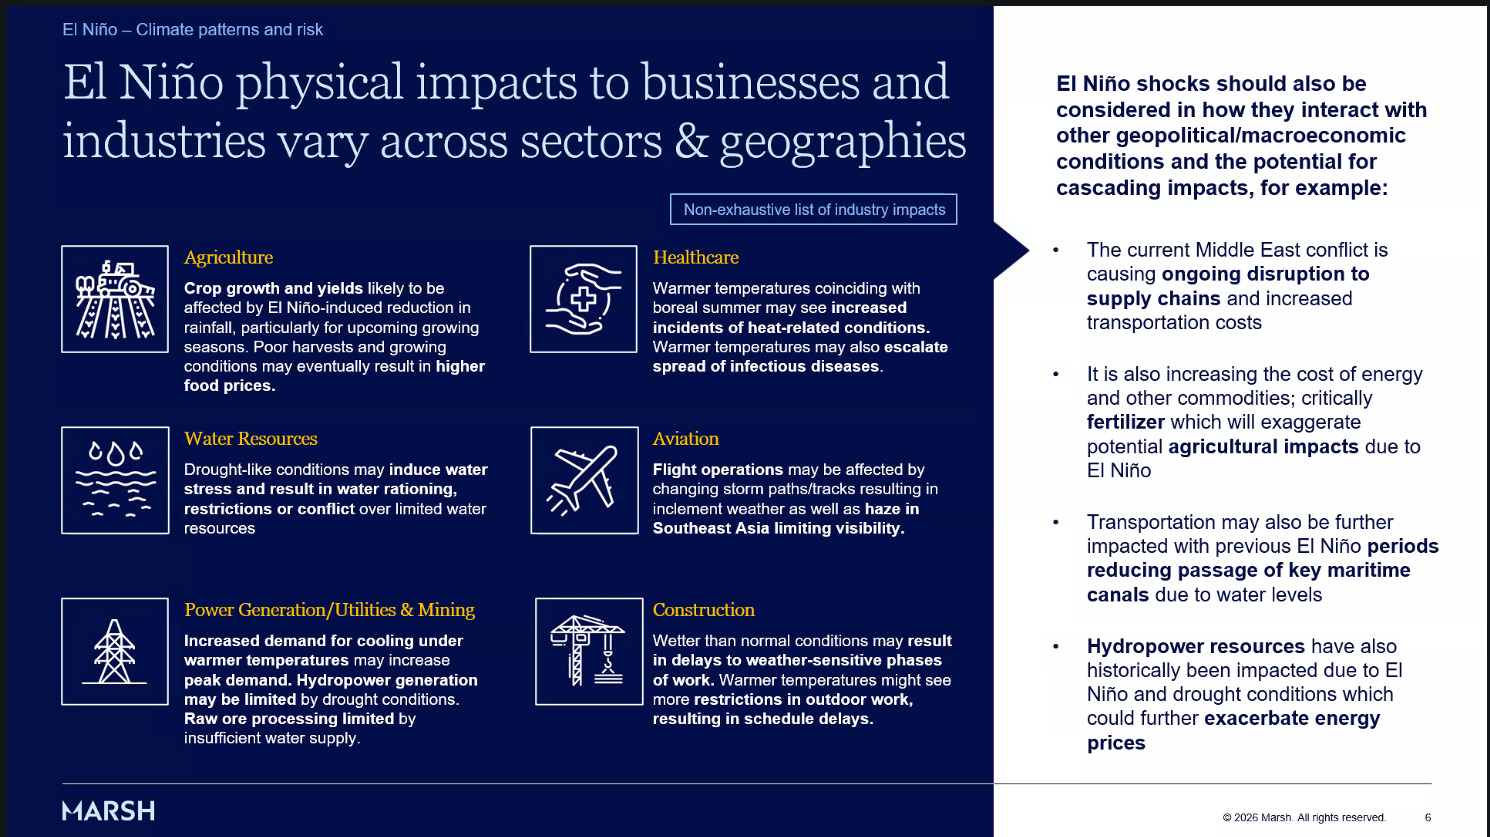
In a webinar on supply chain resilience, insurance brokerage and risk management company Marsh’s Swenja Surminski, managing director of climate and sustainability, stressed that El Niño is more than a weather phenomenon and its impacts vary by geography and sector.
“This may include flooding, landslides, drought, crop loss, food insecurity, power-system stress, and transport disruption,” said Surminski.
Using their supply chain mapping and risk analytics tool, Sentrisk, Marsh analysts reviewed global supply chain risk. The assessment incorporated over 100 companies and 500,000 suppliers across 10 regions.
Marsh research showed that the Southern U.S. and Gulf region, China, Latin America, and Central America have high concentrations of upstream suppliers. China housed 50% of all mapped suppliers. The most pressing issue: tier three suppliers have the highest concentration exposure.
“That concentration exposure at tier three is of particular concern,” warned Cyphus. "It was a consistent theme throughout our mapping that tier three suppliers, which is the most invisible section of the supply chain, are responsible for a lot of the risk that will manifest when it comes to El Niño years.”
Cyphus cautioned that this risk stems from geographic concentration.
“What we found was that even 81% of high-risk supply sites in China and East Asia sat at tier three,” said Cyphus.
Marsh analysts say a disruption in China and East Asia would have a disproportionate downstream impact, particularly for automotive, manufacturing, and critical infrastructure builds like data centers.
Manufacturing is only part of the story
The origin of raw materials and manufacturing is only part of this supply chain risk. Many nodes across air, land, and inland water systems ensure products can be built, transported, and finally delivered. Each node, based on its location, can have its own set of risks and challenges.
Mapping transit routes and the logistics behind raw materials and other supplies is key to understanding a supply chain’s full exposure. Once that visibility is in place, teams can discuss meaningful workarounds before a supply chain disruption occurs.
Marsh analysts said China and the wider Asia region rely heavily on regional transit layers that must remain intact for final products to leave Asia.
“Between 50% and 57% of ocean-going containers stay within Asia,” said Cyphus. “So even if China is unaffected, and there is an event somewhere else, like in South Korea, it would have a significant impact downstream because the parts of a final product cannot be shipped and assembled prior to being exported to the U.S.”
A great example of this was the slow reopening of Vietnam after COVID. Even though the country was “open,” manufacturing was held back because the Chinese workers and managers were still in lockdown in China.
Cyphus explained this interconnectivity between China and Southeast Asian countries would affect larger items shipped by sea, such as server racks, switchgear, cooling systems, and petrochemical feedstock. These delays would disrupt delivery and increase supply chain risk for manufacturers and cargo owners.
For companies managing complex global networks, the challenge is not simply identifying a risky country or route. It is understanding how one disruption can move across multiple tiers and transportation modes, which is where supply chain risk management becomes critical.
“Through greater visibility, you can start to build a really robust story around where the risk really lies, where the significant vulnerabilities are hiding, and where mitigation measures are most needed,” stressed Cyphus. “So, use data to build that visibility, and use that to guide where your resilience investments are placed. Without data, without visibility, you might be implementing workarounds that are either not effective or not cost-effective for your business.”
Inland Waterways and Panama Canal
While less than a fifth of the world’s inland waterways used for freight transport and logistics, they are essential because, in many cases, there are few alternatives.
According to the International Transport Forum, the top countries by network size for inland waterways are:
China: Represents 18% of the global total, with about 24,000 km actively used for freight.
Russia: Represents 16% of the global total length.
Brazil: Represents 8% of the global total length.
United States: Represents 7% of the global total, featuring roughly 12,000 miles (19,300 km) of commercially active inland and intracoastal waterways.
Europe: Represents 8% of the global total, with about 3,500 km actively used in major EU corridors
“Inland waterways are critical, and many of them have very little substitutability when it comes to transport routes,” explained Sadie Frank, CEO of quantitative risk intelligence company N4EA.
Unlike in Europe, where shippers can switch to rail if inland water levels drop, many shippers worldwide have few options.
“If you look at South America, Latin America, some of these huge river systems that they have, like in the Amazon, are core commodity export regions for grains and fertilizer; they are only accessible via water,” said Frank. “They are susceptible to water fluctuations. There are many places that are so core to the major inputs to the world’s food system, and there really isn’t a substitute in many cases for waterways.”
With El Niño set to take hold of the Panama Canal again, N4EA is already seeing mitigation measures in action through rerouting.
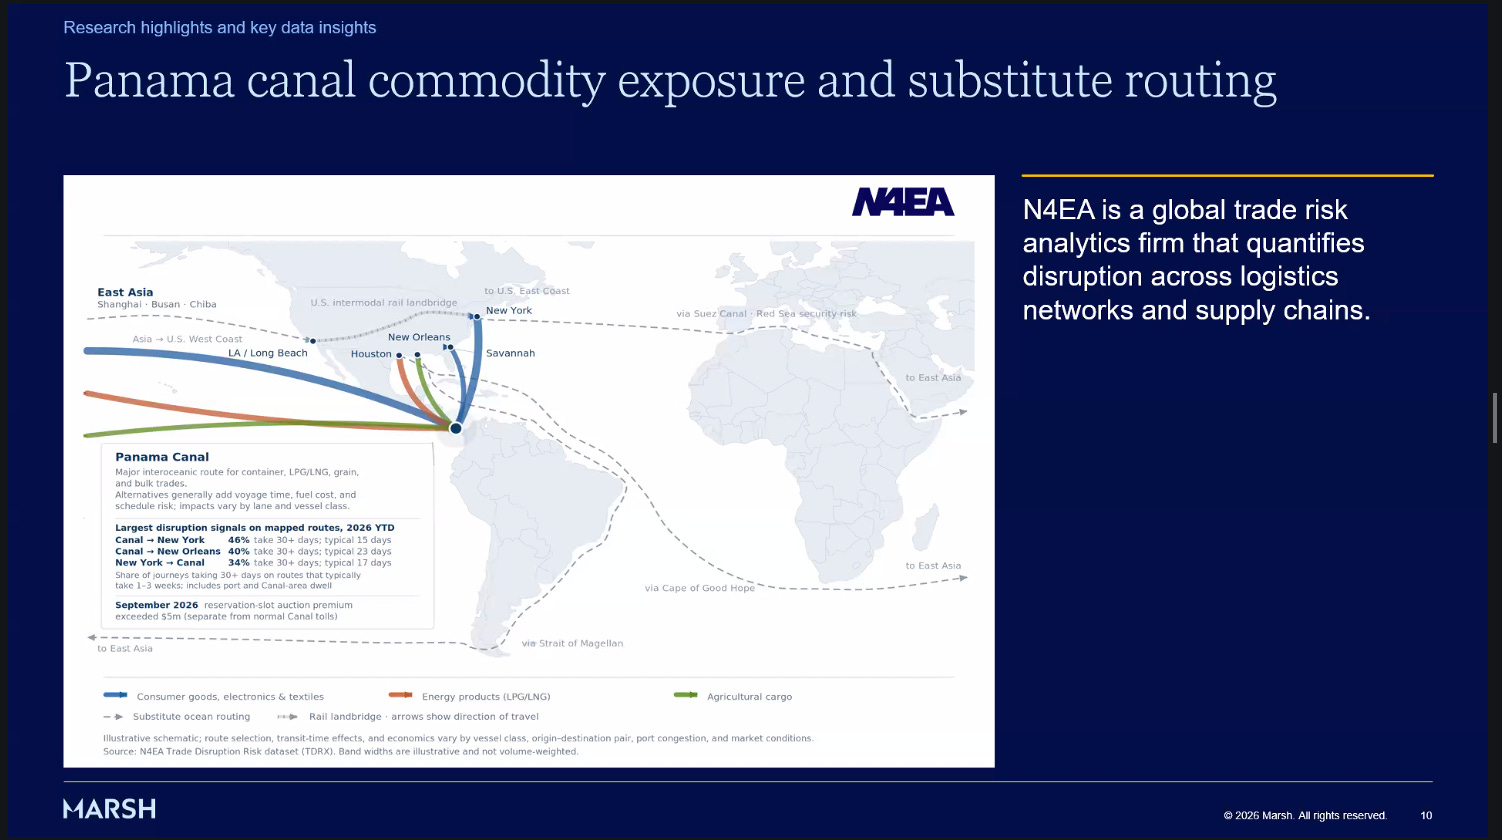
“What our data is showing is that we're starting to see risk stack on key routes out of Panama into the U.S.,” said Frank. “What this means is that the potential for delay on routes that are already at higher risk. For example, delays between Busan and New York will likely increase. So if you’re shipping time-sensitive goods, especially larger project components like data center inputs, that can magnify the risk of delay and disruption.”
Other sectors to be impacted by such delays include consumer goods, basically anything headed for big box retailers, U.S. Agriculture fertilizer, and refrigerated cargo.
“Anything that has a time-sensitive component attached to it is typically where delays really bite,” said Frank. “Looking forward to what we can expect in the coming months and in the year, is that we can expect probably the canal to continue to implement strict water management protocols. This means longer delays, more competition for transport slots.”
This competition, which has driven historic auction slot prices and participation, is something I have been writing about and discussing in interviews, including my latest interview on Supply Chain Unchained.
“When shippers try to utilize alternatives, it can potentially raise the cost of goods,” said Frank.
N4EA and March both recommend shippers and cargo owners identify what they can control in their logistics supply chain and map exposures on a product-by-product level ahead of time, so not every product is exposed to Panama, but many will be.
“That means go SKU by SKU, and then really understand that this is a recurring risk,” said Frank. “This is a risk we can actually forecast to some extent and predict, in contrast to geopolitical disruption. This really requires mapping your exposure comprehensively and understanding where you can take action.”